 [1]
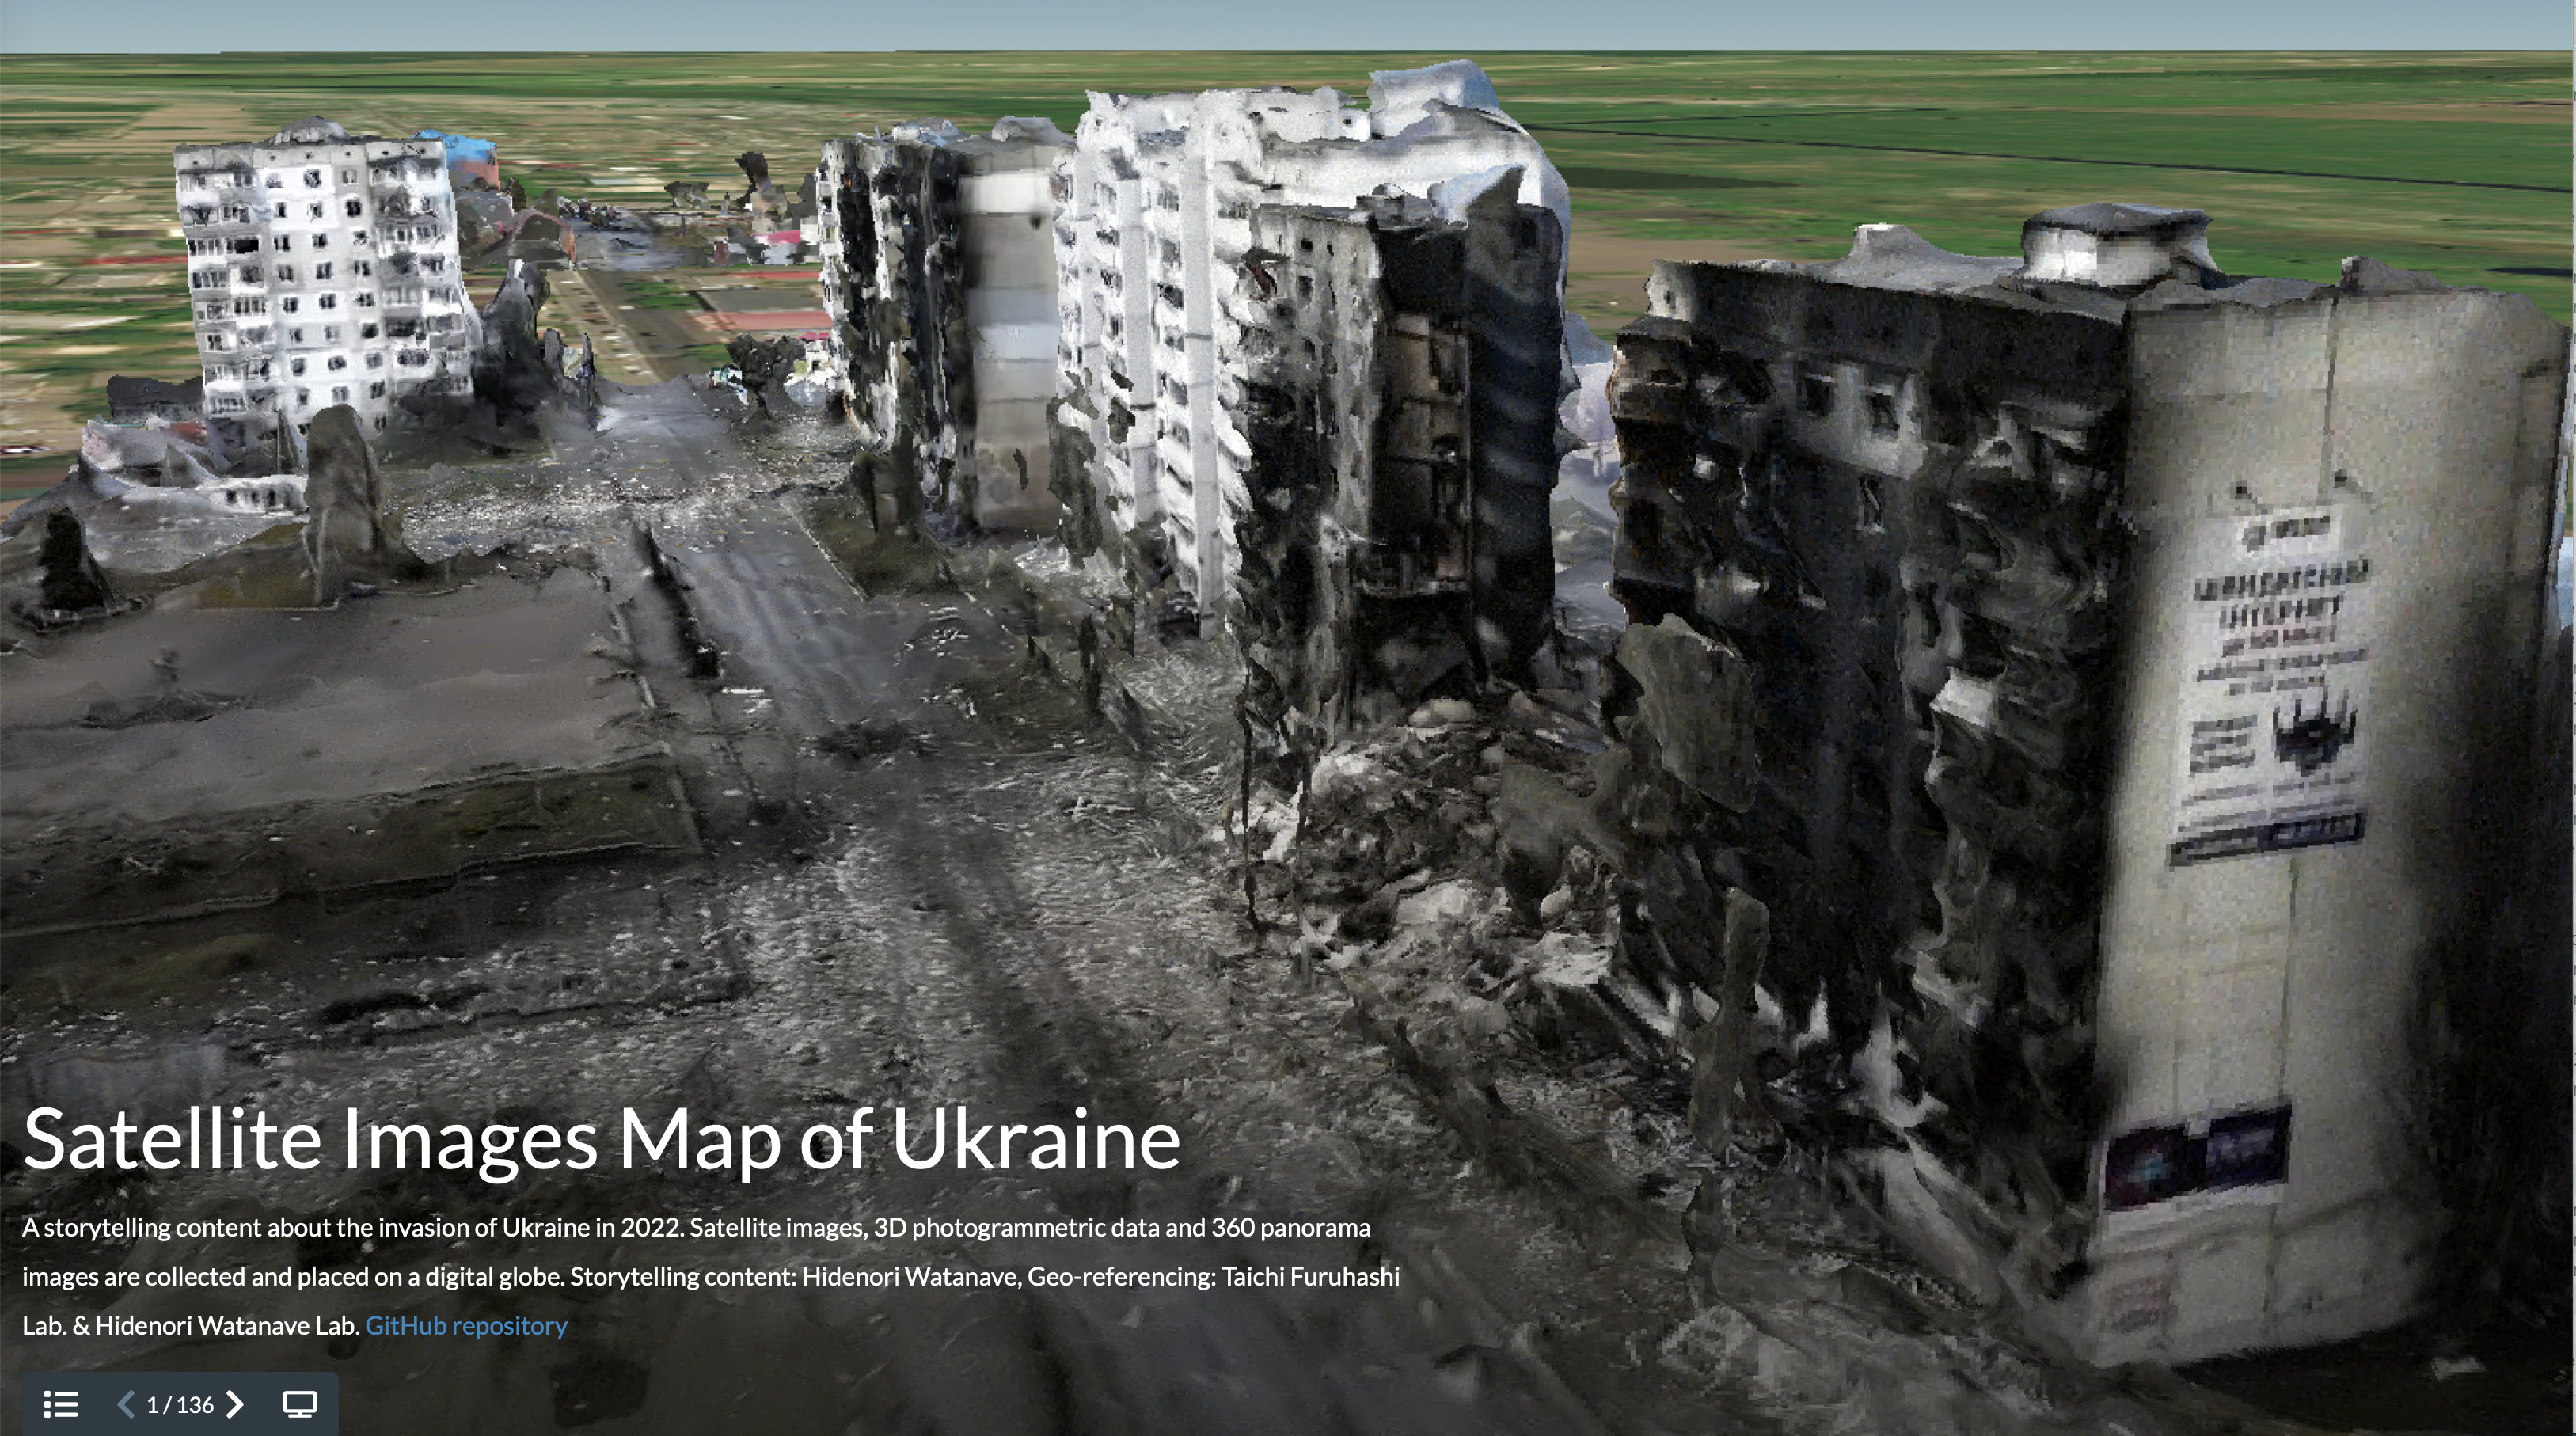
[1]The ‘Satellite Images Map of Ukraine Project [2]‘ presents of images of war damage in Ukraine, such as evidence of fire visible in the windows of a destroyed building. Image provided by Hidenori Watanave [2], used with permission.
Japanese mapping researcher Hidenori Watanave [3]‘s newest collaborative mapping project documents damage and destruction caused by Russia's ongoing invasion of Ukraine.
The project, called Satellite Images Map of Ukraine [4], incorporates satellite images, drone footage, and 3D visualization to track, organize, and verify damage to Ukraine, as well impacts on the civilian population. Various cities and regions in Ukraine have been mapped so far, including Mariupol, Irpin, Chernihiv, and Bucha.
We have organized here the results of a time series verification of the burial ditch found at the St. Andrew church in Bucha, including previous satellite images and GoogleStreetView. It can be downloaded as a simplified geo-referenced KMZ files. @hwtnv [5] https://t.co/NYqLLAdwzd [6] pic.twitter.com/zaix7hXvzC [7]
— Taichi Furuhashi 🇺🇦 (@mapconcierge) April 4, 2022 [8]
[Note: Taichi Furuhashi of Aoyama Gakuin University is a collaborator on the project.]
The images can be viewed as guided walkthroughs on the project website [9], and the original models are available on SketchFab [10], an online community devoted to sharing 3D, VR (virtual reality) and AR (augmented reality) imagery.
In an interview [2] with the University of Tokyo, Watanave says:
画像は、ネット記事やTwitterなどを通じて世界中に拡散していますが、詳しい位置情報は示されていないため、ウクライナのどの地点のものなのかは実は正確にはわかりません。わかるのはマリウポリ(Mariupol)などの地名くらいです。私たちが行なっているのは、配信された衛星画像の詳細な地点をGoogle Earth上で探し出し、特定することです。特定できたら、画像の縦横比や方位、歪みを調整して実際の場所にぴったり重なるように調整し、デジタル地球儀プラットフォームの「Cesium」にマッピングして公開しています。
Images [of the war in Ukraine] are spreading all over the world on the Internet articles and on Twitter. However, since there is no detailed location information, it can be hard to tell exactly where about these images are in Ukraine. All you can understand is the general name of a location, such as ‘Mariupol.’ What our team is doing is finding and identifying the detailed locations according to satellite imagery on Google Earth. Once we identify the exact location, we then refine the aspect ratio, orientation, and distortion of the image to perfectly match what the actual location looks like, and then map everything on Cesium [11] [a browser-based mapping platform].
In an email interview with Global Voices, Watanave said:
地図で示すことで全体像がとらえやすくなる。被害の実情をより深く考えて欲しい。膨大な画像を整理して提示することで、各国が発表する情報の検証にもつながる。その意思を助け,世界中に届けるための補助をしたい。
By showing the effects of war on a map, it becomes easier to grasp the whole picture of what is happening — my hope is the others can better understand the facts of the extent of the damage. As well, by organizing and presenting a huge amount of images, it will also lead to verification of information published by each country. I would like others to use [our mapping tool] as journalistic news content, and to verify what is occurring in Ukraine.
The project may also serve to provide a historical record of the invasion of Ukraine, Watanave says.
Working with collaborators, Watanave maps and visualizes images from a variety of sources, including from satellite imagery, and from drone footage. The mapping project makes use of photogrammetry [12] to create 3D images of real-world buildings and the damage inflicted on them.
Watanave's project also includes satellite multispectral imaging [13] to map fire in near real-time.
Comparison of multispectral images of #Mariupol [14], #Ukraine [15] on March 24th and 29th. There are still many fires in the city. The fire in the factory in the south has been extinguished. pic.twitter.com/i6Etv6cStk [16]
— Hidenori Watanave, Ph.D. (@hwtnv) March 29, 2022 [17]
Watanave, a professor and researcher at the Graduate School of Interdisciplinary Information Studies [2] at the University of Tokyo, works with many collaborators to map the images, including Maxar [18] and Blacksky [19], which contribute satellite imagery. Other collaborators include Hibari Solutions [20], a 3D imaging specialist, as well as Simeon Schmauss [21], Yaroslav Veprev [22], Nickolay Omelchenko, Akihiro Takahashi, Taichi Furuhashi [23], Taichi Furuhashi [23], and Maksym Khovalko [24].
Various collaborators initially got in contact on the SketchFab website and on Twitter, Watanave says, adding that open source intelligence (OSINT) techniques, such as researching publicly available online resources to identify and verify precise geographic locations adds to the power of the project).
Speaking to the University of Tokyo, Watanave says [2]:
軍や為政者が嘘をつきにくい時代になっているのかもしれません。たとえば、ロシアは軍事施設しか攻撃しないと主張していますが、衛星画像をみれば、軍事施設以外も攻撃しており、一般市民が被害を受けていることは一目瞭然です。こうして地図に画像を重ね合わせていくと、個別の衛星画像である点と点がつながって線になり、さらに面をなすので、全体として何が起きているのかをイメージしやすい。
[We may be entering] an era where it's difficult for the military and politicians to lie. For example, Russia claims to only target military installations, but satellite imagery shows that Russian forces are attacking non-military facilities, and that civilians are being harmed. When an image is superimposed on a map in this way [and] where individual satellite images are connected from dot to dot […], a picture comes into focus, and it is easy to visualize what is happening as a whole.
The Satellite Images Map of Ukraine [4] project has been arranged in several categories so far, including:
- Satellite images maps of Ukraine [4]
- 3D data and 360 panorama maps [9]
- Satellite image map of Mariupol [25]
- Satellite image map Irpin and vicinity [26]
- Satellite image map of Chernihiv [27]
Watanave has also uploaded a demo of the Ukraine mapping project to YouTube.
Following the invasion, the Japanese government acted to quickly impose sanctions, with some limits [28], on Russia, and crowds gathered across Japan in support of Ukraine.
