With ever-increasing amount of news information making its way onto the Internet every day, the question of how to parse and interpret this information is becoming more and more critical. Services such as Newsmap [1] tackle this problem by visualizing data from news flows in a 2-dimensional space in an attempt to reveal patterns in news reporting.
Japanese blogger and engineer id:kaiseh [2] [ja] has taken a somewhat different approach with their visualization tool HatenarMaps [3] [ja], which made a splash [4] [ja] in June of this year, and more recently with Newsgraphy [5], launched on September 25th. Both tools use Voronoi Treemaps [6] to display data in a 2-dimensional space, HatenarMaps taking its information from Japan's popular blogging platform Hatena Diary [7] [ja], Newsgraphy drawing in news feeds from Yahoo! News [8] [ja]. id:kaiseh has also developed a popular [9] [ja] visualization service for tracking the top bloggers on Hatena Diary through number of bookmarks and RSS readership, referred to as TopHatenar [10] [ja].
 [3]
[3]
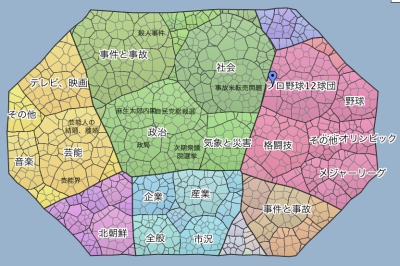
Screenshot from HatenarMaps [3].
In a post from June 9th, id:kaiseh explains how HatenarMaps works [11]:
このサービスを簡単に説明すると、はてなダイアリーのユーザに、獲得ブクマ数に応じた領土面積を割り当て、さらに似た者同士の領土を隣接させるという試みです。
地図の全体を見渡すことで、はてダの大まかなトレンドを掴むこともできるし、スケールを拡大していけば個別記事に到達することもできます。さらに、 Google Mapsで検索するような感覚ではてなidやキーワードを入力して地図を探索したり、「去年と今年で勢力図がどう変わったか」を調べることもできます。
To get a good idea of how HatenarMaps works, have a look at the fantastic video below demonstrating the visualization algorithm. The video cannot be embedded directly, please see pages at Hatena [12] (no registration) or NicoNico Douga [13] (requires registration, English instructions for which can be found here [14]) to watch it.:
![]() [12]
[12]
Video from NicoNico Douga demonstrating visualization algorithm used in HatenarMaps. The video cannot be embedded directly, please see pages at Hatena [12] (no registration) or NicoNico Douga [13] (requires registration, English instructions for which can be found here [14]) to watch it.
HatenarMaps is developed with Java, and uses the following method to minimize the group of all Hatena users to a manageable size:
まず、以下のルールに基づいて、はてなダイアラーの「上位1000人」を抽出します。
1. 被ブクマ数総計の多いユーザから順に抽出。
2. ただし、RSS購読者数が上位2000位以内にランクしていないユーザは除外。
2. However, exclude users whose RSS readership numbers are not ranked in the top 2000.
(The blogger notes that the above steps use the database from TopHatenar.)
Next, vectors are calculated for each of these users:
次に、この1000人についてそれぞれ、被ブクマ数の多い日記エントリのベスト5までを対象に、はてブに付与されたタグの頻度を合計し、タームベクトルを構成します。ただし、タグは全部で数万個あるので、使用頻度の低いタグを切り捨てて、ベクトルの次元数を300まで減らします。
And finally, groups are created through clustering:
各ユーザに対してベクトルが定まったら、そのベクトルを基に、K-means法という手法による非階層的クラスタリングを実行して、1000人のユーザを100個のクラスタに分割します。この結果、はてブタグの類似性が強い(≒日記のテーマが似ている)ユーザ同士がグループを形成します。
このときついでに、グループに名前を付けます。グループに属する全ユーザのタームベクトルを合計し、一番強い成分のタグをグループ名とします。
For further details about how HatenarMaps works, please see the original post in Japanese [11].

Map of news by subject using Newsgraphy
Newsgraphy [5] is a service with a similar concept to that of HatenarMaps. In a September 25th post, id:kaiseh explains [15]:
6月に公開して大きな反響をいただいたHatenarMapsの可視化手法を、Yahoo!のトピックスAPIから取得したニュース記事に適用して、いろいろと機能強化を施したものがNewsgraphyです。Mashup Award 4thにも応募しています。
追記(2008/9/26): 「HatenarMapsの可視化手法を適用」と書きましたが、これは二次元平面へのマッピング手法(Voronoi Treemap)のことで、クラスタリング手法は含んでいません。Newsgraphyは、Yahoo!で分類済みのニュースカテゴリ階層を使用しています。
The blogger then contrasts Newsgraphy with newsmap:
ニュースの可視化と言えばnewsmapが有名ですが、newsmapよりも面白くて実用性の高いサイトを目指して開発しました。
and with HatenarMaps:
HatenarMapsでは各々の領土が角ばっていて、地図というにはやや無機的な感じがしていたので、地形をフラクタル化してみました。かなり自然物に近い見た目になったと思います。
In Newsgraphy, it is possible to narrow the range of visualization through use of a calendar:
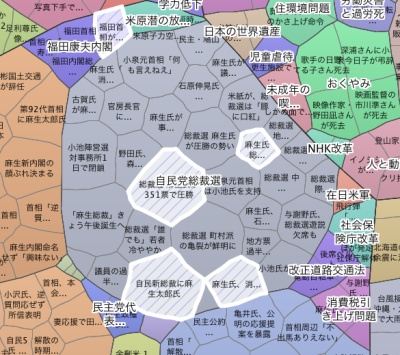
カレンダーで日付の範囲を指定すると、その期間内に報道されたニュースの領土がハイライトされます。この機能を使えば、世間で注目されているトピックが時系列的に推移する様子を観察できます。

Visualization of news in a specific time range (white regions) using Newsgraphy. The grey region is labeled “LDP elections”, and the white regions are news stories on September 22nd on this topic.
id:kaiseh notes later that it is possible to highlight regions by searching for keywords. The default mode colors regions differently according to the category of news, with a 3-color classification scheme used to enable users to survey news from various perspectives.
There is another visualization mode for person/place/organization, which functions as follows:
ニュースの見出しを形態素解析した結果から
* 特定の人物に関わるニュース
* 特定の(地理的な)場所に関わるニュース
* 特定の企業や組織に関わるニュース
* News involving specific (geographic) places
* News involving specific companies or organizations
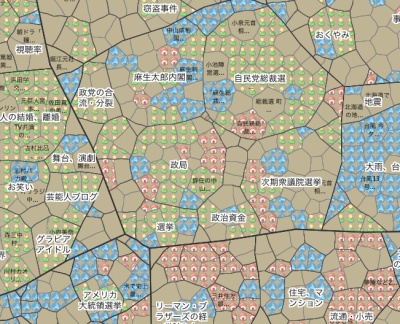
を判別し、それぞれアイコンで表示します。緑が人、青が場所、赤が組織のアイコンです。

Visualization in Newsgraphy by person (green) / place (blue) / company or organization (red)

Region for news about marriages and divorces of famous entertainers, mostly green because it is news about people.
Finally, news can also be categorized by coloring it according to how recent it is. In this method:
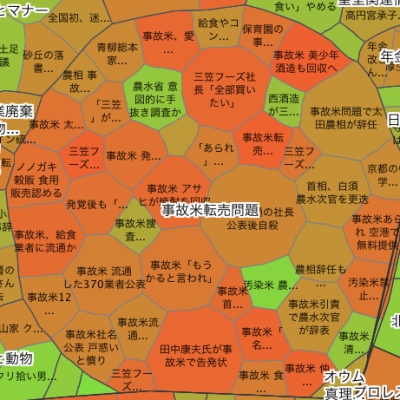
最近のニュースほど緑豊かな領土になり、古いニュースほど土気が多い領土になります。

News about the recent tainted rice scandal, visualized by how recent news items are. The scandal was covered most heavily a few weeks ago, so most news items are brown (old) and not green (new).
The blogger finishes the post with a look to the future of Newsgraphy:
クローリングは今月9日から開始しているので、まだ情報が若いですが、今後半年、1年とデータが溜って地図が成長すれば、かなり面白いニュース傾向分析ができるようになると思います。